PRS10 Rubidium Dying From Old Age
This is data collected from a Stanford Research Systems PRS10 Rubidium Frequency Standard <http://www.thinksrs.com/products/PRS10.htm>, while it is slowly dying from old age.
This device was bought on eBay many years ago, it has serial# 005597 but I don’t know the manufacturing date.
This particular PRS10 is GPS referenced _and_ drives one of my GPS referenced NTP servers. Both of which are hooked up to my data-collection system which allows me to show you the following interesting data.
The NTPns software sees the frequency over the last year like this:
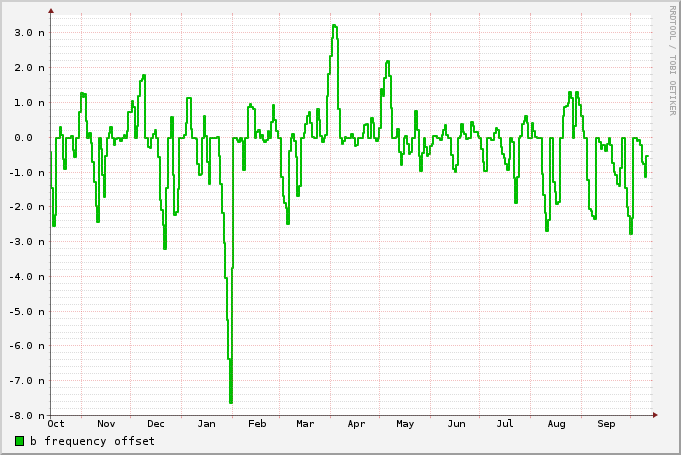
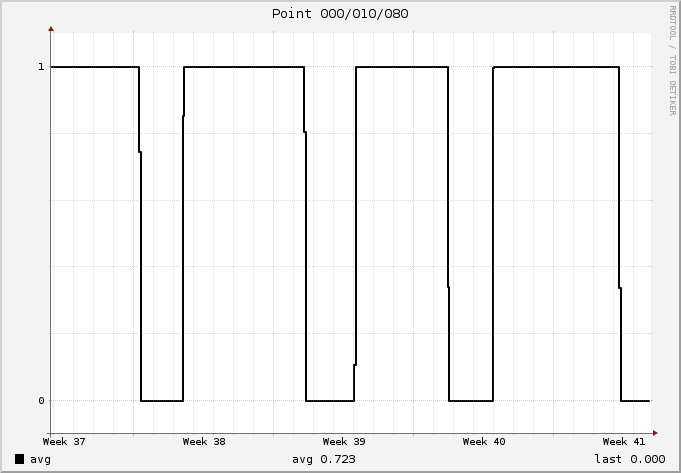
What happens at this point in the life of the PRS10, is that it will drift and out of lock with a frequency of approx once per week.
Notice that even in this state, the frequency on average is still pretty spot on, but with excursions out to almost 1e-8.
Of course I cannot rule out a gradual failure of some electronic component in the PRS10, but the overall picture looks like the optical signal is getting weaker and weaker, an explanation compatible with the common and well known failure mode of Rb absorption in the glass ampoule in the physics package.
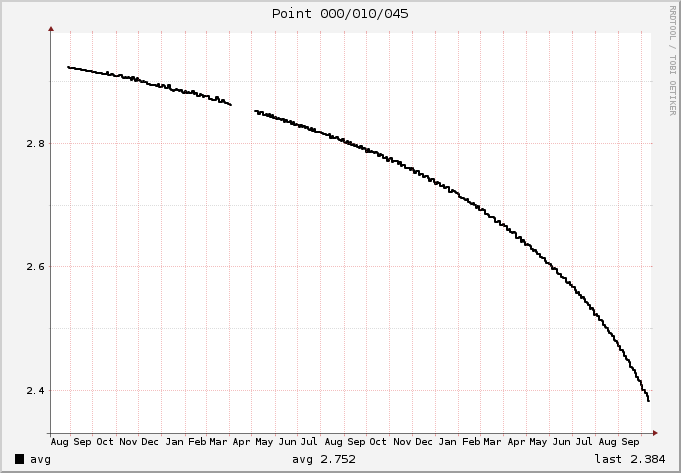
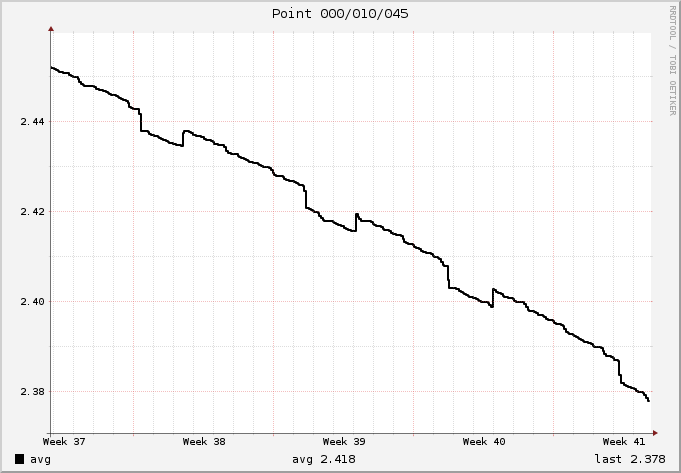
Below are some plots of various interesting data, one plot covers 800 days and the other the most recent month (sep-oct 2012).
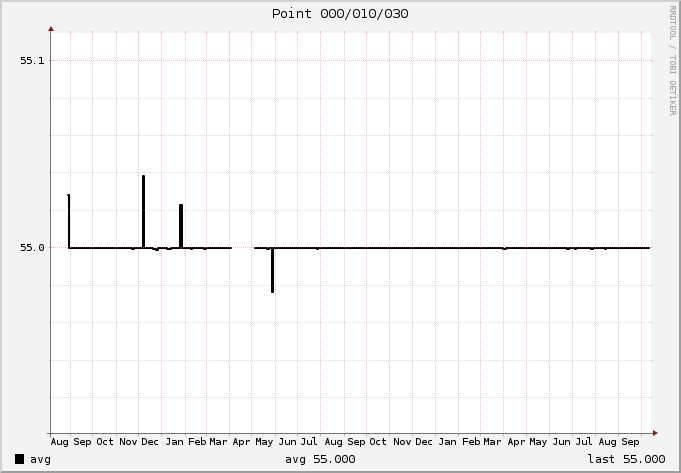
The spikes and holes are data-collection artifacts.
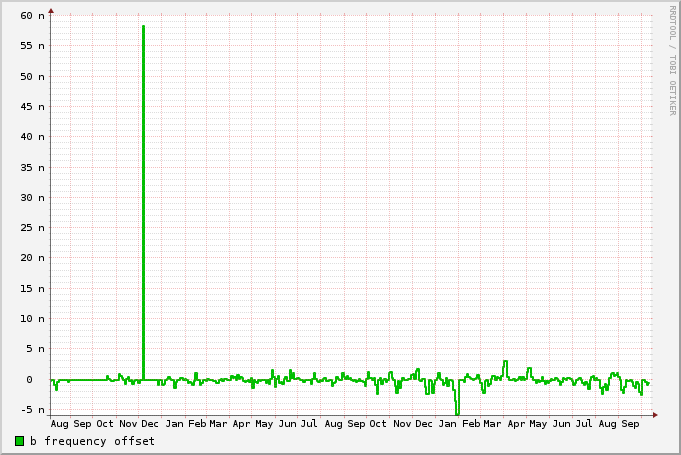
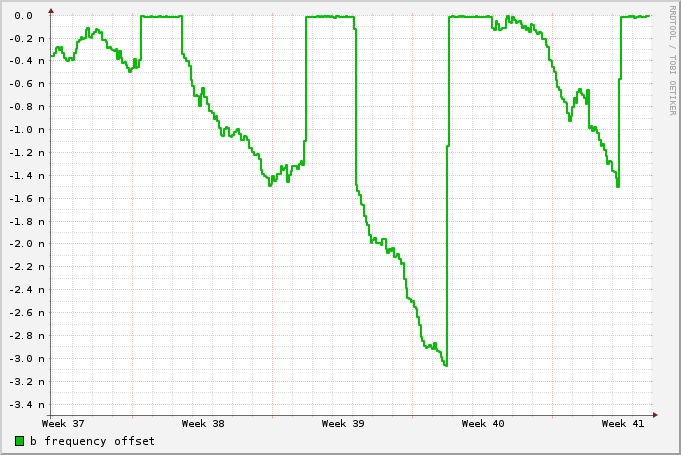
Measured frequency
This is how the NTPns estimates the frequency of the Rb output:
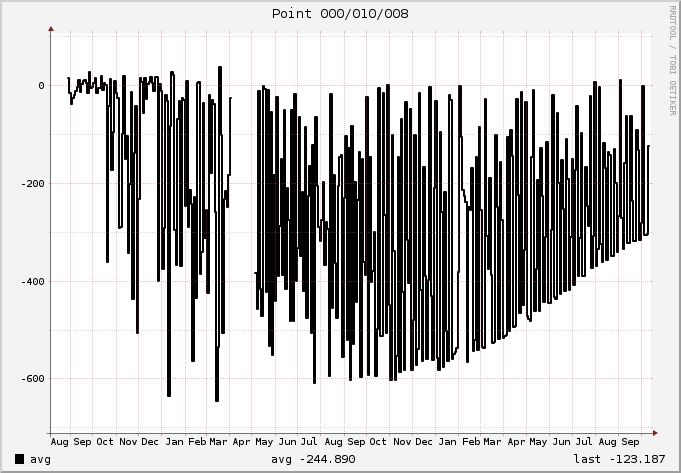
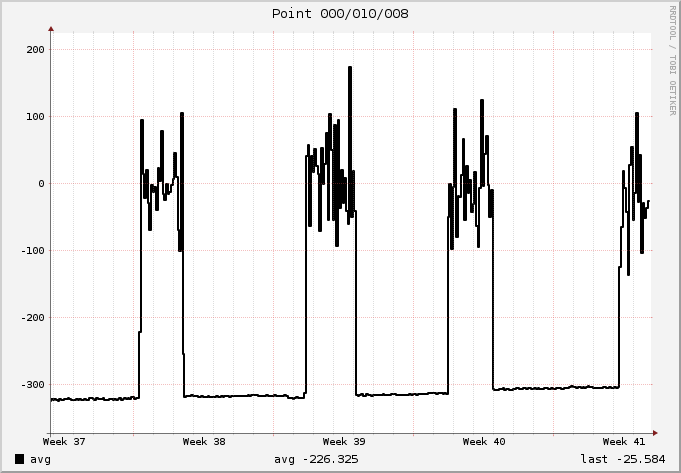
DS – Detected Signal – Error term
This is the strength of the optical error signal (second harmonic)
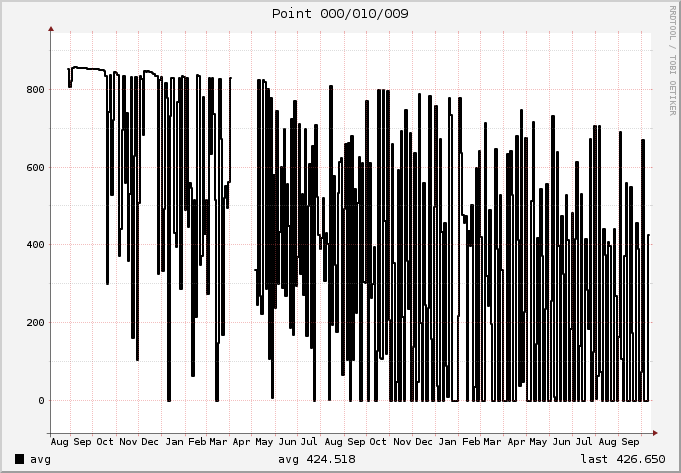
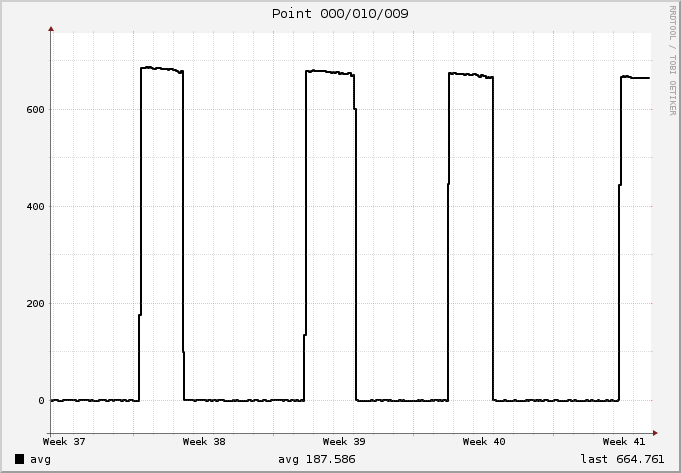
DS – Detected Signal – Signal strength
This is the strength of the fundamental frequency of the optical signal.
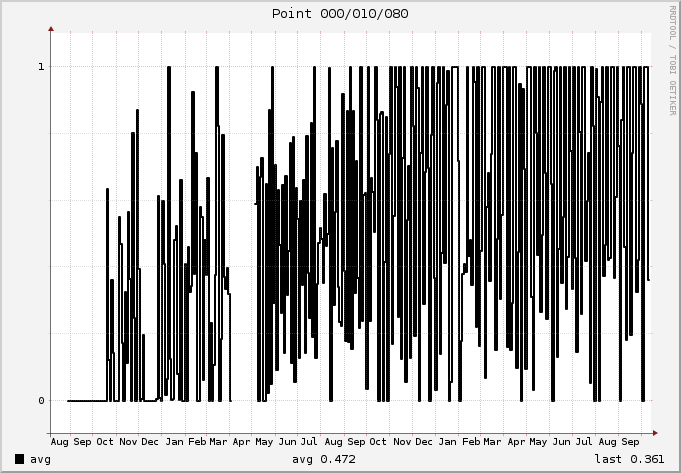
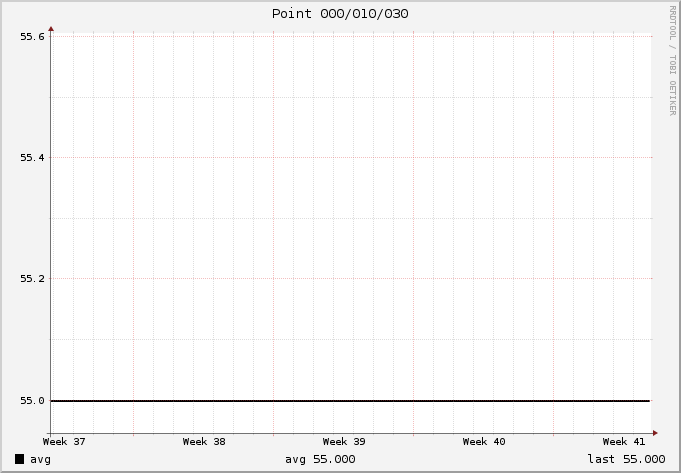
ST4 – Frequency Lock Control Off
PLL lock indication
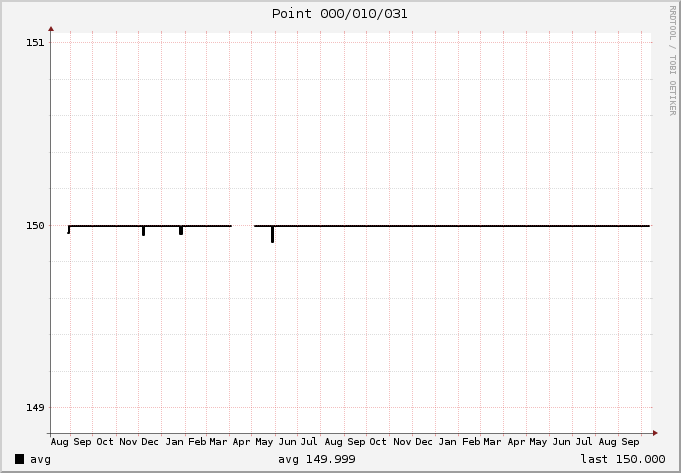
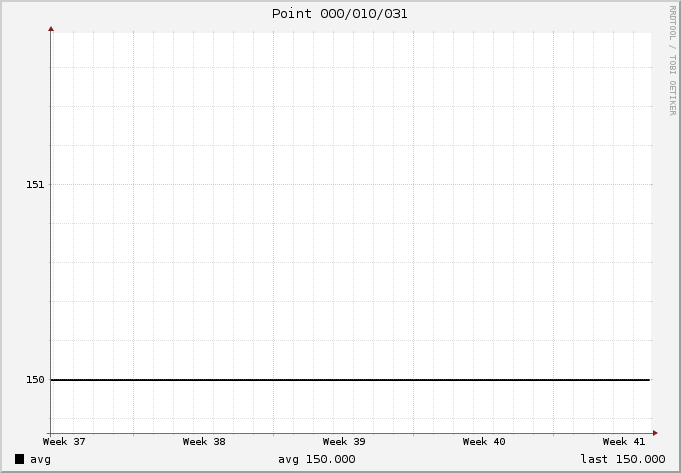
AD9 – Photocell’s I/V converter voltage divided by 4
It is not entirely clear from the manual what this signal represents, but it looks like the peak value of the raw optical signal.
SD2 – Lamp Intensity
These are outputs from the microcontroller. It is very likely that further lifetime can be teased out of this device by tweaking them.
Unfortunately they are “factory only” calibration constants, so I cannot test that theory.
SD3 – Lamp Temperature
See above.
_phk_