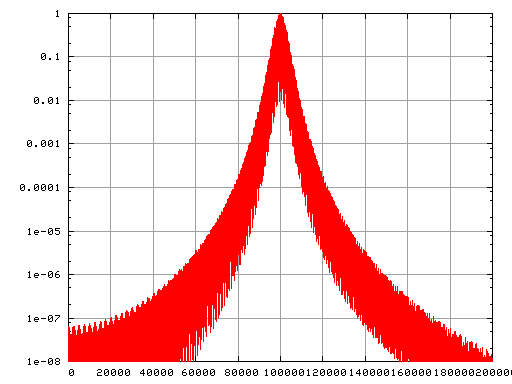
This is the spectrum from 0 to 200 kHz for the 6731M signal. 50 kHz from the center frequency the signal is 120dB down.
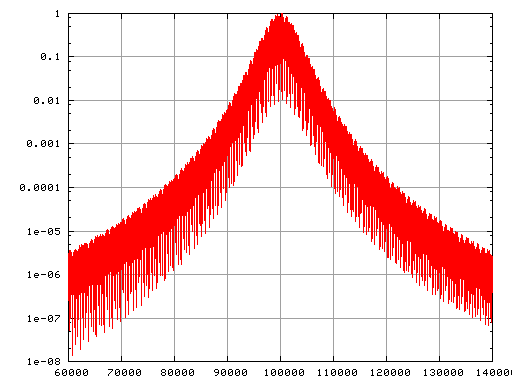
Zooming in, we can see that the 90-110 kHz thing is merely where the signal is 40dB down, that means that the out of band signal is in the order of a percent or so. Certainly not neglible, but probably ignorable in the receiver.
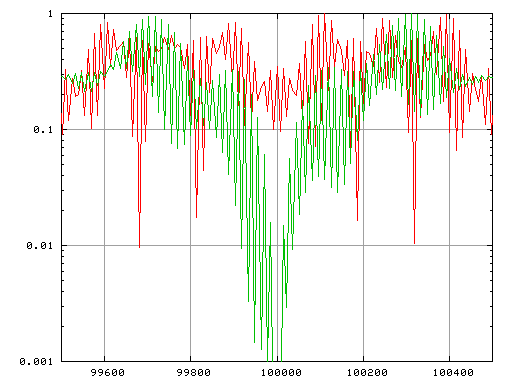
When we zoom all the way in, the micro-structure of the spectrum starts to appear. The red curve is 6731M, the green is 6731S. The Slave signal has a very deep null at exactly 100kHz due to the balanced nature of the signal. Interestingly, the GRI has very little influence on the microstructure.